
Environmental studies
Modeling the water & wildlife impacts on Galveston Bay
Before advancing the Bayshore Desalination Facility, EPCOR commissioned two independent studies from Texas A&M University at Galveston—one on salinity impacts at the intake and outfall, and one on effects to fish and other underwater species.
The findings at a glance
Max mean surface salinity increase within 1 km of the tidal dam.
Share of species collection found near the intake & discharge areas.
Optimal salinity range for peak larval recruitment across species.
Planned discharge salinity — inside the optimal range.
Salinity modeling across the entire Galveston Bay region.
Salinity modeling results
The animation below shows Texas A&M's computer modeling. The left frame shows existing salinity levels with no desalination plant. The two frames to the right show the moderate changes from a fully operational plant—the middle across the entire bay, and the right zoomed to the intake channel at Dickinson Bay and the outfall channel to the south.
Key findings
- ✓Within 1 km of the tidal dam connecting the discharge channel to the bay, mean surface salinity increases by only ~0.12 parts per thousand, and impacts diminish rapidly offshore.
- ✓Salinity change is more pronounced near the intake channel, yet still increases less than one part per thousand in Dickinson Bay—because the intake pulls gulf seawater into naturally fresher water from Dickinson Bayou.
- ✓Differences dissipate entirely between 1–2 km at the outfall channel and within 5 km of the intake channel.
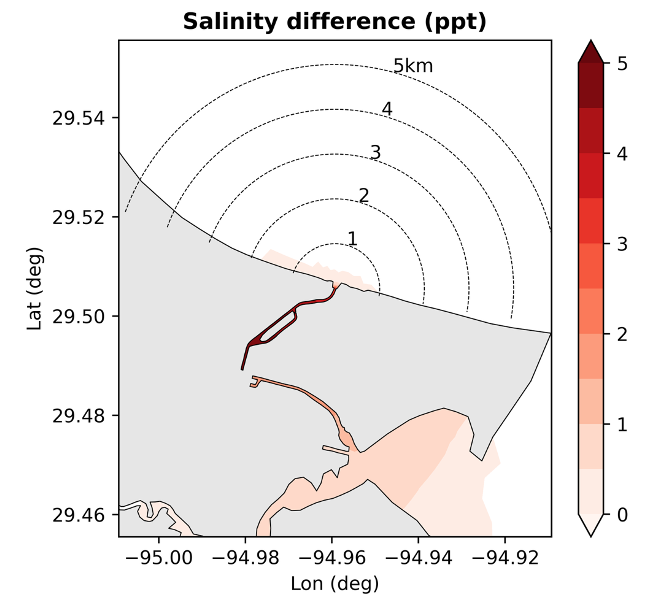
Wildlife habitat impacts on key species across ~40 years of catch data.
Wildlife impacts results
A habitat study assessed impacts on the species that rely on Galveston Bay as a nursery—red and black drum, brown and white shrimp, spotted seatrout, flounder, oysters, blue crab and seagrass. Roughly 40 years of Texas Parks and Wildlife catch data was used to determine each species' abundance.
Key findings
- ✓Presence around the discharge and intake areas accounted for less than 5% of the overall species collection across the entire bay.
- ✓The one exception was eastern oyster at 15.5%, due to the proximity of nearby oyster reefs.
- ✓Species were collected across salinities of 0.9–27.9 ppt, with some found from 0 ppt up to 35 ppt.
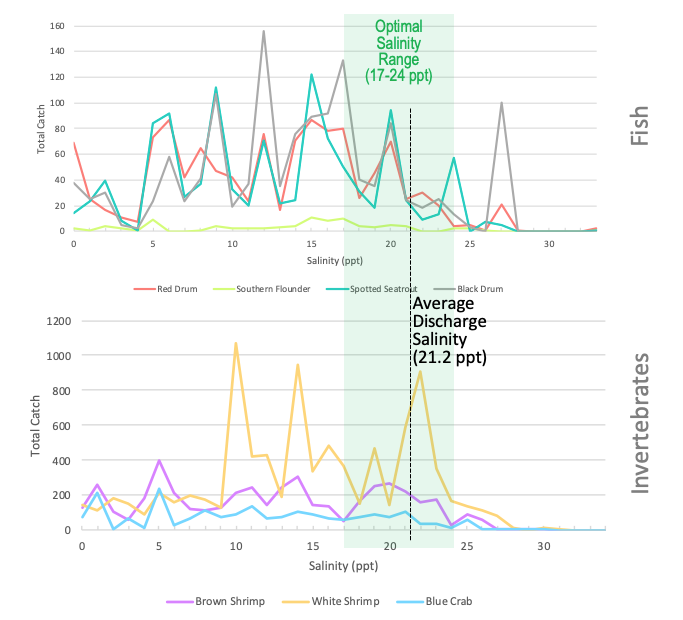
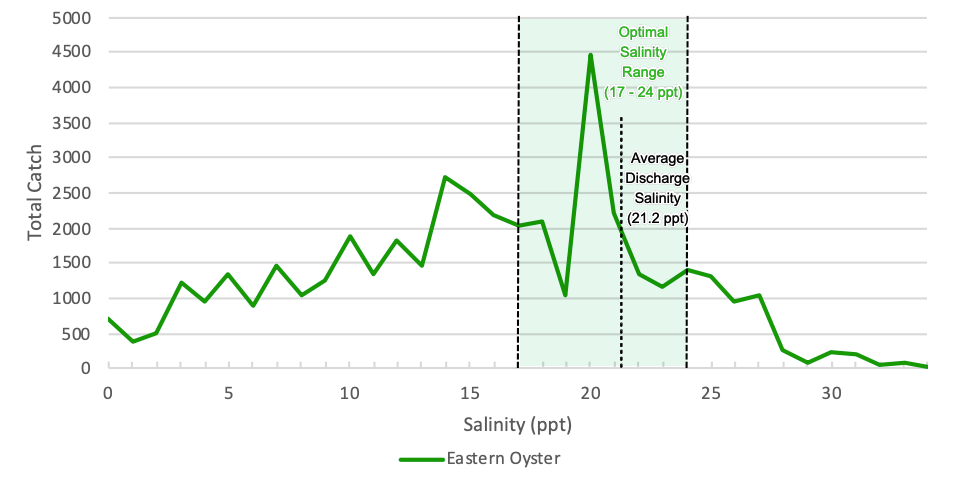
The optimal salinity range for peak recruitment and larval development across all species was 17–24 ppt. The planned discharge salinity of 21.2 ppt falls squarely in the middle of that range.
Current site conditions
Photos of the proposed site and the remains of the decommissioned P.H. Robinson Generating Station. Click any photo to enlarge.